5
4
1647
3

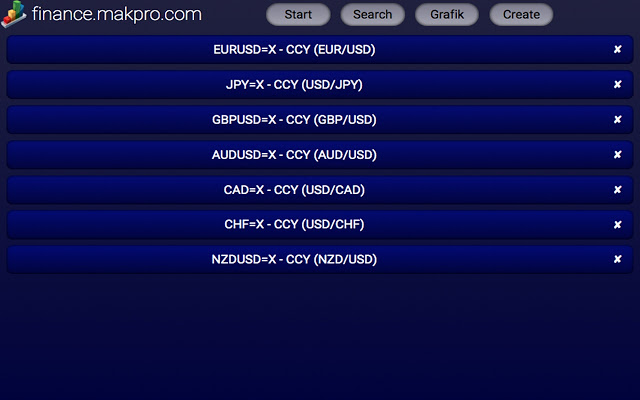
You can see the graphs of stocks or currencies, you can make history analysis, you can create indicators.
Graphical representations take place via tradingview. In addition to bars, candle and area displays, 60 indicators can be displayed (three at the same time).
You can generate buy-sell signal by using the data of 20 indicators, add stoploss with percentage or indicator and make analysis for previous years. In this way, you can see profit or loss in the past years, you can examine buy and sell signals in detail.
This project is finished as it is described and continues to develop.
It is very useful for semi-professional users.
I think it’s nice. As it becomes perfect.
good