
The extension helps run java script on the page. The good point is that the extension is powered by jQuery version 1.10 which helps in debugging any html page you have currently opened up in the browser.
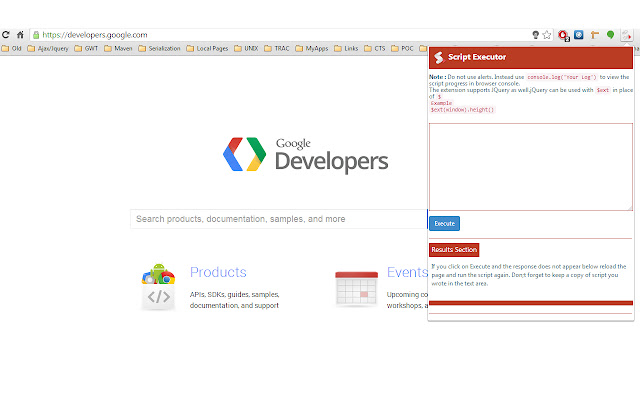
For using Jquery use $ext instead of $ to run your scripts.
For example if I want to find number of anchor tags on the page: I would write $ext(‘a’).size() in the text area to get the number in result section below the execute button. Similarly try using window.location.href to get the current url in result section.
You can write multiple lines of script and execute to see the logs in console as do not use alerts in the script. To see logs in the console. Press F12 to open the chrome developer tool and then click on the console tab.
Logging in Script Area example:
try writing console.log(‘Your message’) and click Execute button or alternative you can use the log method directly like log(‘My Message’).
Try executing this script on any page.
$ext(‘a’).each(function(){
log($ext(this).text())
});
This will result in printing every link text on the page in console.
Use It and play around with the html in your browser.
Happy Scripting !!!!
Are yall okay? You can’t hack on roblox because this is a “chrome executor” its an extension it stays in chrome and you have to download a real one. Grow up
This is very very useful when im running a website javascript for example my destroy the website javascript is very good when im bored and in games i play surviv io and i have my cheats and aimbot thanks for this executer!
how do i use it?
I legit feel bad for the kids with Chromebooks who thought they were gonna exploit lol
didnt even excute any scripts
Everyone in this section complaining that a browser executor can’t hack roblox
so literally barely anything executed
the scripts didnt even exacute this is trash why didnt it work
Ugh, it can’t even run a single script!
dont work
Alot of scripts dont work
i cant use it for roblox trolling
IT DOESNT WORK IN MOST SCRIPTS
Works great. Everything you need. I do wish that it could save scripts that you create.
Most of the codes did not execute.